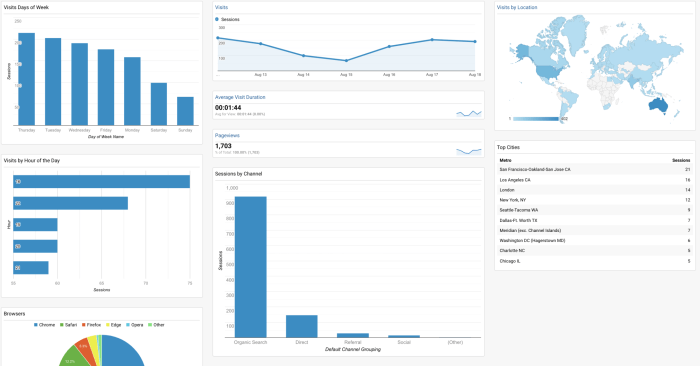
Using Google Analytics for Insights takes you on a journey through the world of data analysis, revealing hidden patterns and valuable information for businesses to thrive. From setting up to tracking key metrics, this guide will show you how to make the most of Google Analytics.
Introduction to Google Analytics: Using Google Analytics For Insights

Google Analytics is a powerful tool that helps businesses track and analyze website traffic and user behavior. By providing valuable insights into how visitors interact with a website, Google Analytics allows businesses to make data-driven decisions to improve their online presence and ultimately increase conversions.
Purpose of Google Analytics
Google Analytics is designed to help businesses understand their audience better and optimize their online performance. It provides detailed data on website traffic, user demographics, behavior, and interactions, allowing businesses to track the effectiveness of their marketing efforts and optimize their website for better user experience.
- Track website traffic and user behavior
- Identify key trends and patterns
- Measure the effectiveness of marketing campaigns
- Optimize website performance and user experience
Key Features of Google Analytics
Google Analytics offers a wide range of features to help businesses gather valuable insights and make informed decisions. Some key features include:
- Real-time data tracking to monitor website activity as it happens
- Customizable reports to analyze specific metrics and dimensions
- Goal tracking to measure conversions and track progress towards objectives
- Audience segmentation to identify different user groups and target them effectively
- E-commerce tracking to monitor online sales and revenue
Benefits for Businesses
Using Google Analytics can benefit businesses in various ways, such as:
- Understanding customer behavior to improve marketing strategies
- Optimizing website performance for better user experience
- Measuring the ROI of marketing campaigns and advertising efforts
- Identifying areas for improvement and growth opportunities
Setting up Google Analytics

To set up Google Analytics for a website, follow these steps:
1. Sign in to your Google Analytics account or create one if you don’t have it already.
2. Click on “Admin” in the bottom-left corner.
3. Under the Account column, click on “Create Account” and follow the instructions to set up your account.
4. Once your account is set up, click on “Create Property” under the Property column.
5. Enter your website information and URL to create a new property.
6. After creating the property, you will receive a tracking ID and tracking code to add to your website.
Correctly configuring Google Analytics is crucial for accurate data tracking and analysis. It ensures that you are collecting the right information to make informed decisions about your website performance, user behavior, and marketing strategies.
Different Tracking Codes in Google Analytics
There are different types of tracking codes available in Google Analytics, including:
– Universal Analytics tracking code: This is the standard tracking code used for most websites and provides detailed insights into user interactions.
– Google Analytics 4 (GA4) tracking code: This is the latest version of Google Analytics and offers enhanced tracking capabilities, including event tracking and user-centric data.
It’s essential to choose the right tracking code based on your website’s needs and goals to gather accurate data and maximize the insights provided by Google Analytics.
Using Google Analytics Reports
Google Analytics offers a variety of reports that provide valuable insights into website performance and user behavior. By understanding how to interpret these reports, you can make informed decisions to optimize your online presence.
Types of Reports in Google Analytics
Google Analytics provides the following types of reports:
- Audience Reports: These reports focus on the characteristics of your website visitors, such as demographics, interests, and location.
- Acquisition Reports: These reports show how users are finding your website, including sources like organic search, paid search, social media, and referrals.
- Behavior Reports: These reports analyze how users interact with your website, including page views, bounce rates, and session durations.
- Conversion Reports: These reports track specific goals and conversions on your website, such as lead generation or e-commerce transactions.
Interpreting Data from Google Analytics Reports
When interpreting data from Google Analytics reports, it’s essential to look for trends, patterns, and anomalies. Pay attention to metrics like bounce rate, average session duration, and conversion rates to identify areas for improvement.
For example, a high bounce rate on a specific landing page may indicate that the content is not engaging enough for visitors.
Actionable Insights from Google Analytics Reports
By analyzing Google Analytics reports, you can gain actionable insights to enhance your website performance. Some examples include:
- Identifying top-performing pages and optimizing them for better user engagement.
- Adjusting marketing strategies based on the most effective acquisition channels.
- Testing different website elements to improve conversion rates.
Tracking Key Metrics
In order to effectively measure the performance of your website and make informed decisions, it is crucial to track key metrics in Google Analytics. These metrics provide valuable insights into user behavior, traffic sources, and overall website performance.
Important Metrics to Track in Google Analytics:
- Pageviews: This metric indicates the total number of pages viewed on your website, giving you an idea of overall traffic volume.
- Unique Visitors: Tracking unique visitors helps you understand how many individual users are visiting your site.
- Bounce Rate: Bounce rate measures the percentage of visitors who navigate away from your site after viewing only one page, indicating engagement levels.
- Conversion Rate: This metric shows the percentage of visitors who complete a desired action on your site, such as making a purchase or signing up for a newsletter.
How Tracking Metrics Can Help in Decision-Making:
By monitoring these key metrics in Google Analytics, you can gain valuable insights into the effectiveness of your website and marketing strategies. Tracking metrics allows you to identify areas for improvement, optimize user experience, and make data-driven decisions to enhance overall performance.
Comparing and Contrasting Different Metrics for Website Performance Evaluation:
| Metric | Use Case | Difference |
|---|---|---|
| Pageviews | Overall traffic volume | Measures total number of pages viewed |
| Unique Visitors | Individual user count | Tracks number of distinct visitors |
| Bounce Rate | Engagement levels | Percentage of visitors leaving after one page |
| Conversion Rate | Action completion | Percentage of visitors completing desired actions |
Utilizing Custom Dashboards
Custom dashboards in Google Analytics are personalized views that allow users to track specific metrics and data points relevant to their unique goals and objectives. These dashboards can be customized to display the most important information at a glance, providing a quick overview of key performance indicators.
Creating a Custom Dashboard, Using Google Analytics for Insights
To create a custom dashboard in Google Analytics, follow these steps:
- Navigate to the “Customization” tab in your Google Analytics account.
- Select “Dashboards” and click on “Create.”
- Choose between creating a blank canvas or using a starter dashboard template.
- Add widgets to your dashboard by selecting the type of data you want to display (such as metrics, tables, or charts).
- Customize each widget by selecting the specific metrics, dimensions, and filters you want to include.
- Organize the layout of your dashboard by rearranging and resizing widgets as needed.
- Save your custom dashboard for future use and analysis.
Best Practices for Designing Custom Dashboards
When designing custom dashboards in Google Analytics, consider the following best practices:
- Focus on relevant metrics that align with your business objectives.
- Avoid clutter by only including essential data points that provide meaningful insights.
- Use visualizations like charts and graphs to make data easier to interpret at a glance.
- Arrange widgets logically to create a cohesive narrative and flow of information.
- Regularly review and update your custom dashboard to ensure it remains relevant and effective.


